An analysis of the time demand for periodic and aperiodic communication is highly relevant in planning. From the beginning of systematic settlement and communication planning, it has been a principal objective to link the important places of human activities by effective communication links or to optimise locations in respect to existing links in order to account for the highest macro-economic and micro-economic efficiency or a minimum ecological impact.
The analysis and the cartographic presentation of traffic flows should be dedicated to objectivity, acceleration and transparency of these planning processes. For the individual traffic by cars, commercial products are already fulfilling this task. PC-based route planning and built-in navigation systems exemplify this statement. In the present project, the focus is on public transport. An example is given for the Dresden case.
The following principal goals have been defined:
As a result of a preceeding feasability study, an elaborated parameter catalogue and a complex system of cartographic signs was at hand in 1999. With the finish of the software development in 2000 now a closed, semi-operational software solution can be presented, which is neither restricted to a specific timetable (updating problem), nor to a specific place (Dresden in our case) or certain transport media. A prerequisite for the successfull use in different environments is a well-defined input data model, which might require some transformations of an initial data base. The time demand calculation, the core of the software, has a generic character. This required extensive programming and adaptions of ARC/INFO functions. Inherent route finding algorithms could be used. However, model constrains had to be taken from complex relational data structures, and the optimisation runs through numerous iteration steps with a stepwise update of the input parameters.
In the test case, digital timetables of Dresdner Public Transport (internal name: EPON) were post-processed after being dumped as ASCII tables. Original data are composed of 18 individual tables, which are designed to support the complete internal facility management. Three tables are needed for our analysis ("FRT", "LIN" und "ORT"). Locational relations are only indirectly stored by the names of stops and stations and their IDs. A 'geocoding' for the use in a GIS had to be established using a digital road and public transport coverage of Dresden, which had been generated at the Institute for Cartography before. It is giving access to tabular data (feature attribute data) of the line coverage ("NAT", "AAT"). An interaction scheme is given within Figure 1.
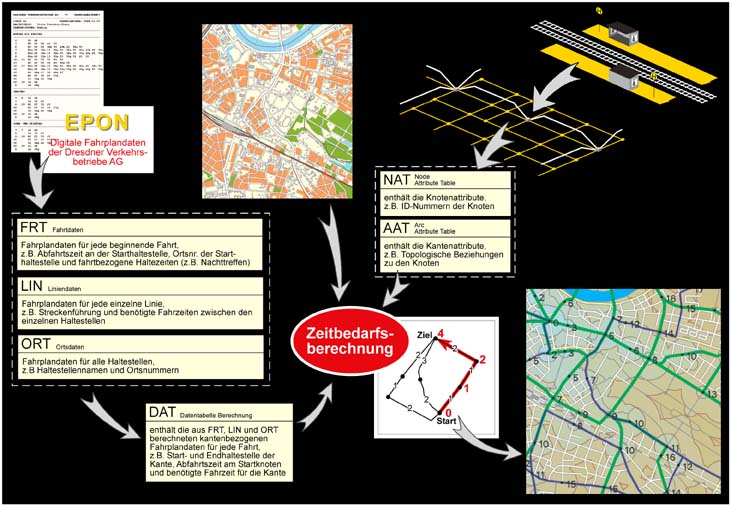
Implemention makes use of the ArcMacroLanguage, a meta-language of Arc/INFO. All steps can be invoked by a graphical user interface. exept step 1.2, the geocoding of the stops. But even here, the user is guided by a specific graphical menue.
The main steps of a programme run can be listed as follows:
The integration of digital time tables and topographic data bases in a GIS is a sensible job. An improved quality and an extended analytical potential can be realised. Some non-automated effort, which is necessary for the geocoding of the 'coordinate-free' timetables in the beginning, is easily compensated by a wide field of applications. Once that the system is established, updates are quickly done, since the network geometry does rarely ever change completely. Some aspects of the remarkable analytical potential of the integrated data might be mentioned here:
Deficiencies in the presented solution within Arc/INFO and resulting unavoidable "work-arounds" in the implemention are basically due to:
Warm regards shall be expressed to the students involved to this project and to the staff of Dresden Public Transport, who gave access to their data and informations.
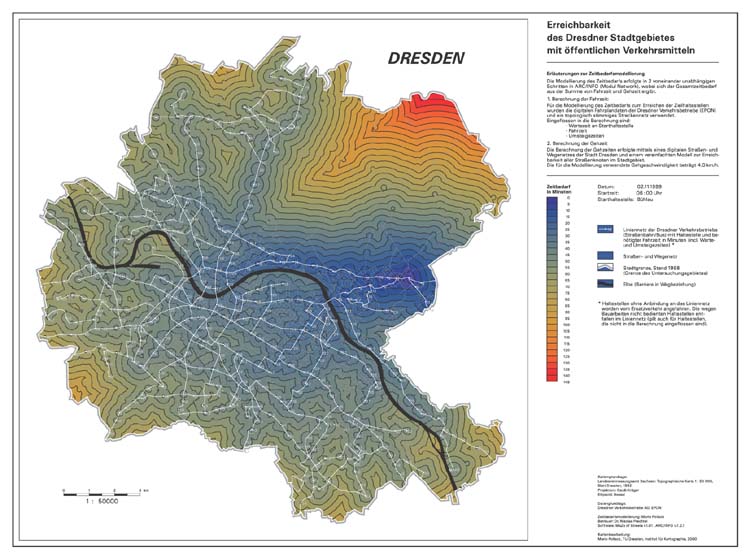
Starting point "Postplatz" at 6:00 a.m. (2.11.1999), colour scheme: modified spectral colours
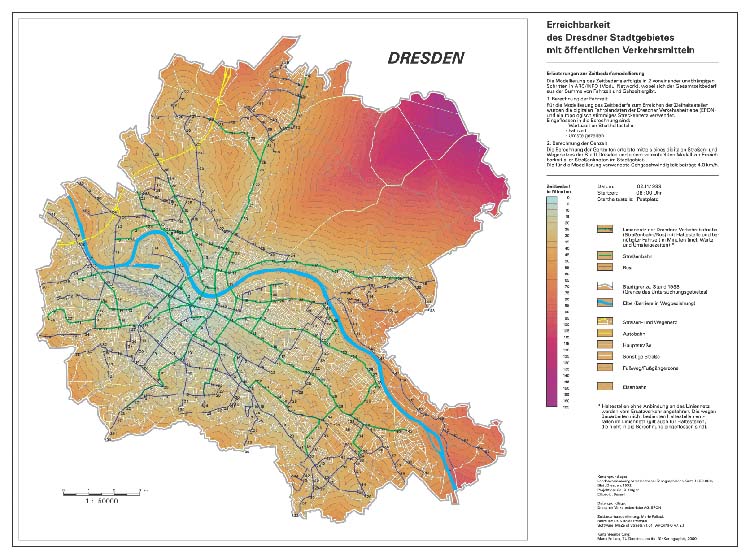
Starting point "Bühlau" at 6:00 a.m. (2.11.1999), colour scheme: chromostereoscopic
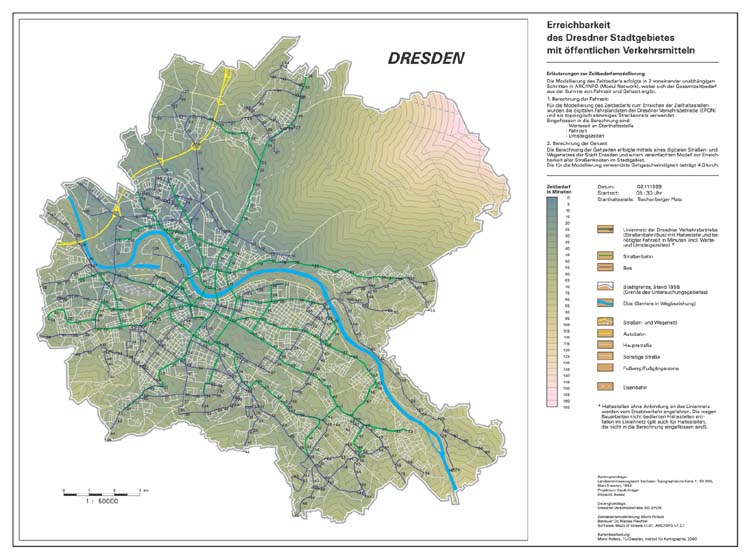
Starting point "Trachenberger Platz" at 6:00 a.m. (2.11.1999), colour scheme: elevation layer